Navigation Menu 
[expand all...]
[COLLAPSE ALL...]
|
|
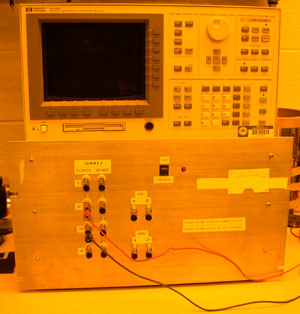
HP4156A Precision Semiconductor Parameter Analyzer
Contact
Information:
Faculty
Contact:
Aaron Hawkins
Staff Contact:
Don Dawson
|
Expand All
Compress All
- General Description
The Hewlett Packard 4156A Precision Semiconductor Parameter Analyzer is an extremely useful
tool for characterizing semiconductor devices. It has up to four probes that can
serve as voltage sources, current sources, voltage monitors, and current monitors.
These probes are designed to be programmed through a menu-driven user-interface.
Possible measurements include, I-V curve of a simple two terminal device,
Id-Vds-Vg
graphs for MOSFETs, switching characteristics of logical gates, etc.
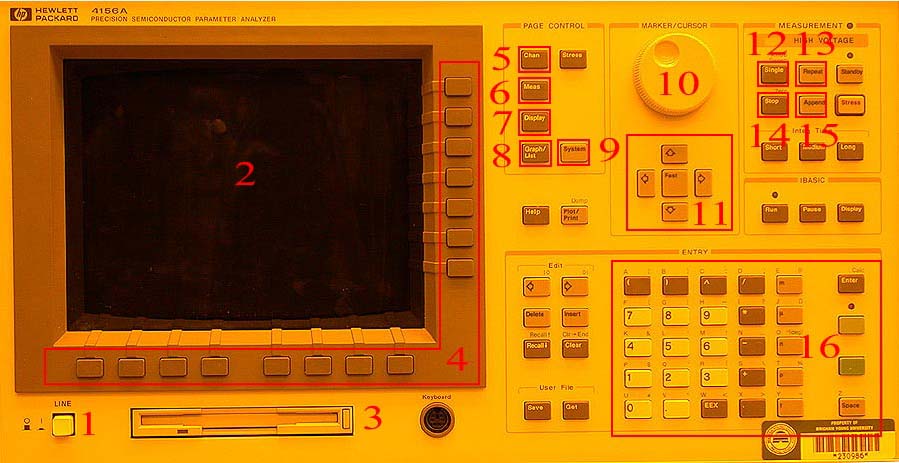 - 1. Power Button
- 2. Display
- 3. 3 1/4 disk drive
- 4. Soft Keys
- 5. CHANNELS Menu Button
- 6. MEASUREMENT Menu Button
- 7. DISPLAY Menu Button
- 8. GRAPH/LIST Menu Button
- 9. SYSTEM Menu Button
- 10. Thumbwheel (used for moving cursor on graph, or selecting softkey menus)
- 11. Cursor Movement, and Field Selection buttons - The Fast Key allows the cursor to move faster while in the Graph Mode
- 12. The SINGLE button - will perform one sweep with the setting that the user has determined, will clear previous graph data
- 13. The REPEAT Button - will perform continuosly repeating single sweeps
- 14. The STOP button aborts current measurement
- 15. The APPEND button will perform a single sweep, without clearing previous graph data
- 16. Text/Number Entry Keys
- Operating Instructions
- Programming the HP4156A to do a particular measurement requires stepping through a
short sequence of menu screens as follows:
- 1) Channels
- Channel Definition
- This is where the operation of the each of the SMUs (source monitor units - the probes)
is defined. A SMU can operate as either a combination voltage source/ammeter or current
source/voltmeter. Depending on the type of measurement, you can use 2, 3, or 4 SMUs, and
if that isn't sufficient, there are two more dedicated voltage sources (Vs 1 and Vs 2) and
two dedicated voltmeters (Vm 1 and Vm 2) that can also be used.
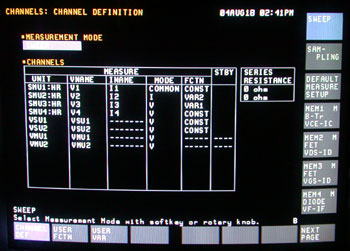 - Measurement Mode
- Sweep
- Sampling
- Default Measurement Setup
- Canned Programs
- The 4156 has several common measurement setups stored in memory. These
can be accessed using the soft keys. Simply punch the appropriate soft key and the setup is done.
- MEM1: B-Tr VCE-IC
- MEM2: FET VDS-ID
- MEM3: FET VDS-ID
- MEM4: DIODE VF-IF
- Channels
- UNIT
- Specifies which SMU will be assigned to a particular variable, mode and function.
- VNAME & INAME
- The names are simply labels that you attach to the particular voltage
and current. For instance, if you are measuring a diode, you might label the voltage for one
of the SMUs as Vdiode and the current as Idiode. But these are simply names for the variables,
the actual names used aren't terribly important.
- MODE
- There are three possible MODEs: V (for voltage source), I (for current source), or COMMMON
(for the common terminal). There must always be one common terminal, and all voltages will be defined with respect to the common terminal.
- FCTN
- Once the MODE of the SMU has been defined, then the FCTN further defines
how the SMU will be used. The SMU source will either be CONST (constant), meaning that the
voltage or current is fixed at some value, or the SMU can function as a variable source, in
which case the voltage or current can be stepped through a sequence of values. There are two
choices for the variable, VAR 1 and VAR 2, so that you can change voltages or currents on two
SMUs in any given measurement. An obvious example of when you would need two SMUs would be when
measuring iD vs. vDS curves for a MOSFET. In that case you would set the gate voltage at some
voltage, and then step the drain voltage through a range of values, measuring the current at
each point. Then you would change the gate voltage to some new value and measure ID vs. VDS
for the new drain voltage. When using both VAR 1 and VAR 2, the 4145 will start by going to
the first value of VAR 2, and then step all the of prescribed values for VAR 1. Then VAR 2
will be incremented to the requested value, and VAR 1 will again be stepped through all of
its prescribed values. In programming parlance, VAR 1 and VAR 2 work like nested DO-loops,
with VAR 1 being the inner loop and VAR 2 the outer loop. A final note: If your measurement
requires changing only one variable, you must use VAR 1.
- User Function Definition
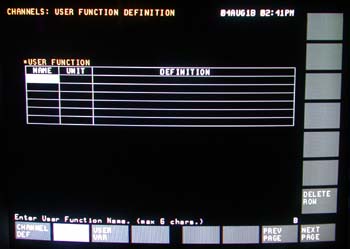 - Your own functions - Notice at the bottom of the channel definition page, there are spaces
for entering user-defined functions. You won't always want to measure a simple voltage or a
current. For instance, in characterizing MOSFETs, it is sometimes useful to measure the
square-root of the drain current.
- User Variable Definition
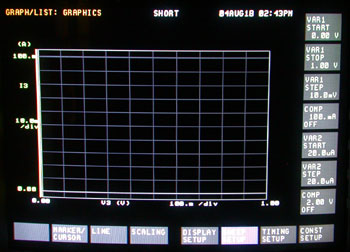
- 2) Measure
- Once you are finished with the channel definitions, you will need to tell the 4156 the
range of voltages and currents that you want to measure. This is done on the Measure: Sweep Setup
page. Push the NEXT key or the MEASURE key to go there, and you should see a page similar to the one shown below.
- Sweep Setup
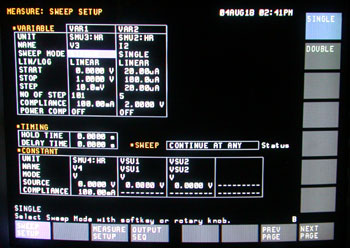 - Sweep Mode
- The sweep mode determines how the measurement points will be spaced. You can
have either a normal linear spacing or a variety of logarithmic spacings. Linear spacing is most
common. Notice that these are entered using soft keys.
- Lin Log
- Start
- Voltage/Current at which the sweep will begin
- Stop
- Voltage/Current at which the sweep will end
- Step
- The increment which the Voltage/Current will vary with each step
- No. of Steps
- The number of steps to make sweeping from one Voltage/Current to the next
- *Note
- The 4156 calculates the number of steps for VAR 1, using the step size, start, and stop.
Curiously, the procedure for VAR 2 is slightly different. For VAR 2, you must enter the starting point, the step size, and the number of steps.
Then the 4156 will determine the stopping point for VAR 2.
- Compliance
- Next, enter a compliance limit for VAR1. The compliance is a way of protecting the
device being measured. If the SMU is used as a voltage source, the compliance is the maximum current
that will be allowed to flow through that terminal of your device. If the SMU is a current source,
the compliance will be the maximum voltage that will be applied to that terminal of your device.
- Power Comp.
- Subtle point:
- When entering values like the start and stop points you need not enter the standard
units (V or A ). However, if you want to enter the value in mV or µV or something like that, you
must include the unit prefix. For example, each of the following is a viable way for entering 20
millivolts: 0.02, 20m, 20000u.
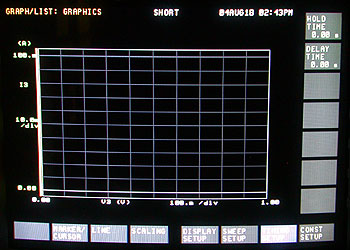
- Timing
- This is used for Holding or Delaying the sweep measurements for special measurements.
- Constant
- Enter values for any constant sources that may be used in your measurement.
- 3) Display
- This page is used to set up the graphics display for the data to be collected. It is important to remember
that entries here affect only how the data will be plotted - it is independent of the information entered on the SWEEP SETUP page.
This means that you could set up the on-screen graph so that none of the collected data would appear!
That data is not lost (it's stored in the machine's memory). All you would need to do in such a case is to redefine the graph.
- Display: Display Setup
 - Display Mode
- You should see the word GRAPHICS following DISPLAY MODE: You can choose other ways to look
at the data using the soft keys. GRAPHICS mode is the most commonly used display mode. Sometimes LIST mode is useful. LIST
mode displays the raw data in one long list.
- Graphics
- Name
- Choose the variable to be plotted
- Scale
- Linear or Log Scale
- Min & Max
- Use these fields to determine the ranges in the x and y for your graph. You will have to use your best judgment
on these values. If you don't get a nice graph after the measurement, you can always come back to this
page and adjust all these settings to give you a better graph.
- Grid
- Turns Grid ON and OFF
- Line Parameter
- Data Variables
- Display: Analysis Setup
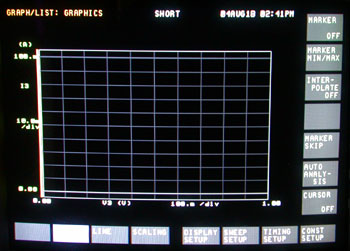
- 4) Graph/List
- This is where all the action occurs. You should see an empty graph, set up according to the entries from
the Display Setup Page. To measure data, you need to push one of the measurement keys. SINGLE will
cause the 4145 to sweep through the full range of VAR1 and VAR2 points, measuring the current at each
point, and plotting the results. Each time you press the SINGLE key, the previous data will be erased
and new data plotted in its place. REPEAT has the same effect as continually pushing the SINGLE
key - the 4156 will repeatedly sweep through the measurement cycle until you push the STOP key.
APPEND is very similar to SINGLE, except that the old data is not erased. You will get two or
more plots, with each new one being superimposed over all the previous plots. This is very handy
for making comparisons between different devices or for measurements taken under different
conditions (eg. with lights on and lights off).
- Graph/List: Graphics
- On the lower part of the screen you will notice a number of menus, accesible by pressing the softkeys. Each menus has options
which allow you to manipulate the data on the screen.
- MARKER/CURSOR
 - MARKER
- The marker is a point on the graph that the user may define. This may be used to compare similar points of data on several different graphs.
- MARKER MIN/MAX
- Pressing this softkey will alternate the marker selection between the min and the max
- INTERPOLATE
- The user can turn this off and on
- DIRECT MARKER/CURSOR
- This option appears whent the cursor is set to either SHORT or LONG
- MARKER SKIP
- AUTO ANALYSIS
- CURSOR
- User may choose between OFF, SHORT, and LONG cursors
- LINE
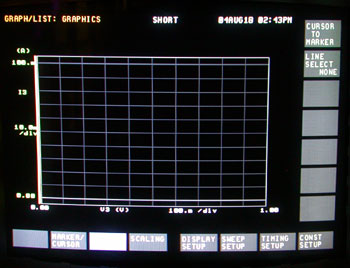 - Options available for graphing lines
- SCALING
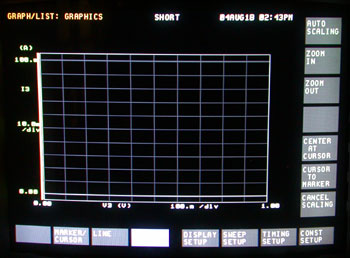 - AUTO SCALING
- It is quite possible that the graphing range you chose on Display Setup
Page wasn't appropriate, so that the graph is mostly (or even completely) empty. AUTO SCALE
will automatically resize the graph so the data very nearly fills up the whole graph. This
is very handy. The only drawback is that the resulting scale is usually an awkward value
like 3.29mA/div. If you want a more readable graph, you can use AUTO SCALE to get a rough
idea of the range of the data, then go back to the MEAS & DISP SETUP page and pick more sensible ranges.
- ZOOM IN
- Zooms in wherever the cursor is centered
- ZOOM OUT
- Zooms out wherever the cursor is centered
- CENTER AT CURSOR
- Centers the display at the cursors position
- CENTER TO MARKER
- centers the display where the marker is loctated
- CANCEL SCALING
- cancels all manual manipulations, and reverts to display setup options
- DISPLAY SETUP
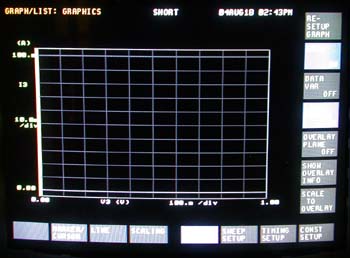 - a user might use this menu to change the DISPLAY SETUP options while monitoring the resulting graph
- SWEEP SETUP
 - a user might use this menu to change the SWEEP SETUP options while monitoring the resulting graph
- TIMING SETUP
 - a user might use this menu to change the TIMING SETUP options while monitoring the resulting graph
- CONST SETUP
- Graph/List: List
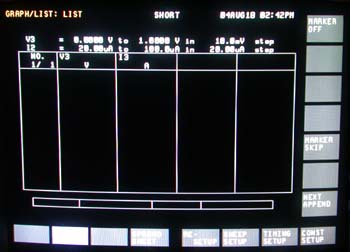 - Marker
- user may turn marker on and off
- Direct Marker
- Marker SKip
- Next Append
- Spreadsheet
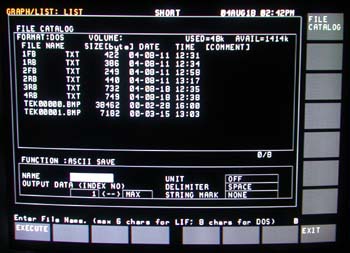 - This is a useful option, as a user can export the graph into a format that is readable in excel, matlab, etc.
- Name
- Filename (8 DOS Characters)
- Unit
- units can be turned on or off
- Output data index
- (1 to 2147483647)
- Delimiter
- Determines which character the values will be separated by.
- Space
- Comma
- Tab
- String Marker
- Determines how the 4156 will denote a string
- " "
- ' '
- None
- Execute
- By pressing the softkey corresponding to this, the list data will be exported and save in the specified format onto the floppy disk.
- 5) System
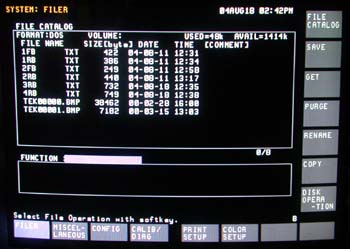 - Since the file formats that this menu outputs are not readable by any know program, this menu is is practically useless. It contains file save and get commands, as well as color setting, and other menus that we don't use very much.

|
